
I had an interesting chat the other day with a Rotherham landlord.
He said he had been talking with an architect who said back in the mid-2000’s, the developments he was asked to draw were a balance of one and two bed properties, compared to today where the majority of the buildings he is designing are more towards two and sometimes three bedrooms.
This of course was all anecdotal, but it made me wonder if similar things were happening in the Rotherham property market?
This is a really important point as knowing when and where the demand of tenants is going to come from in the coming decade is just as important as knowing the supply side of the buy-to-let equation, in relation to the number of properties built in Rotherham, Rotherham property prices, Rotherham yields and Rotherham rents.
In 2001, there were 102,300 households with a population of 248,200 in the Rotherham Metropolitan Borough Council area. By 2011, that had grown to 108,300 households and a population of 257,300.
…meaning, between 2001 and 2011, whilst the number of households in the Rotherham Metropolitan Borough Council area grew by 5.88%, the population grew by 3.67%
Nothing surprising there then.
But, as my readers will know, there is always a but!
My analysis of the 2011 Census results, using the most recent in-depth data on household formation (eg ‘one person households’, ‘couples/ family households’ or ‘couple + other adults households and multi-adult households’), has displayed a sudden and unexpected break with the trends of the whole of the 20th Century.
There has been a seismic change in household formation in our area between 2001 and 2011.
Between 2001 and 2011, the population of Rotherham grew, as did the number of Rotherham properties (because of new home building). However, the growth rate of new properties built in Rotherham was much lower than expected, but the population has still grown by the expected rate, meaning the average household size was larger than anticipated. In fact, average household size (ie the number of people in each property) in 2011 was almost exactly the same as in 2001, the first time for at least 100 years it had not fallen between censuses. (Since 1911, household size has decreased by around 20% every decade).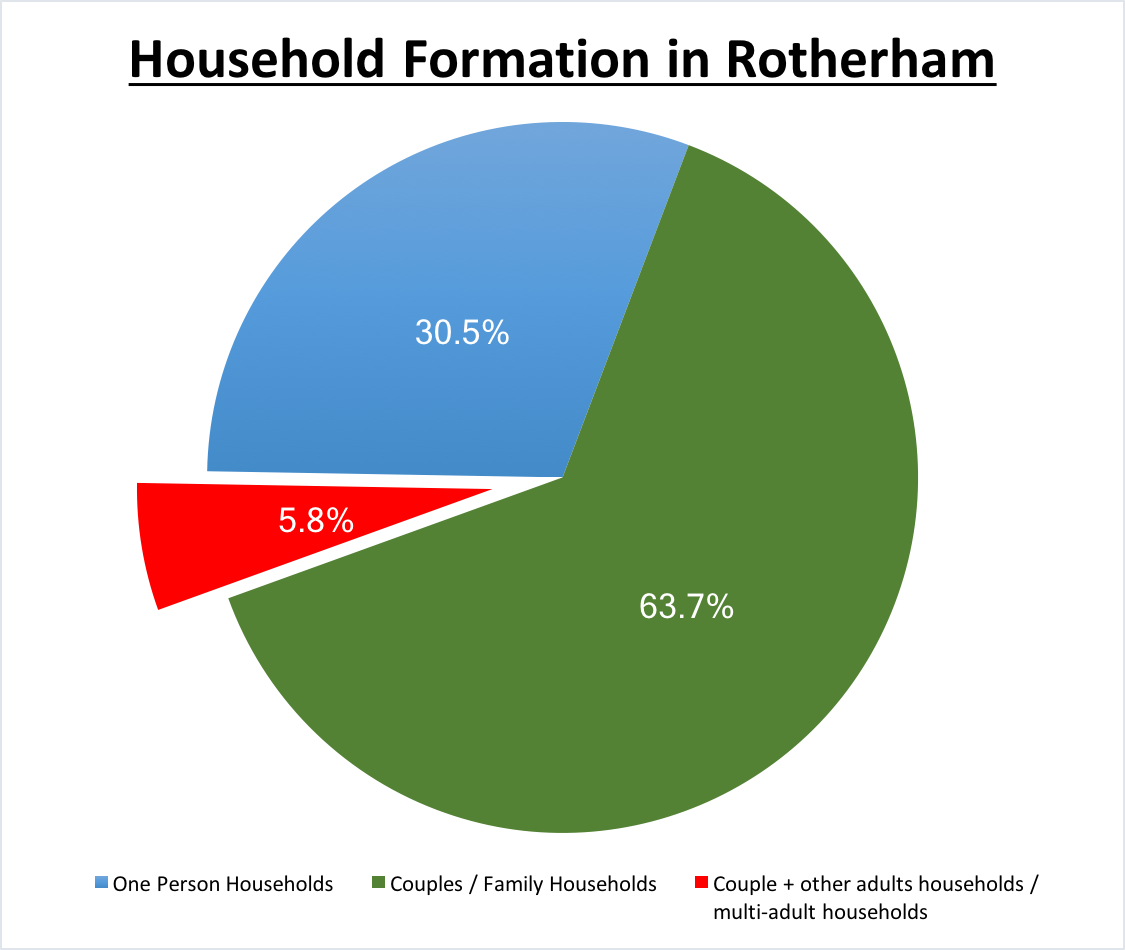
Looking at figures specifically for Rotherham itself:
- One person households – 30.5%
- Couples/family households – 63.7%
- Couple + other adults/multi-adult households – 5.8%
This decline was reflected in large scale shifts in the mix of household types. In particular, there were far more “couple + other adults households and multi -adult households” than expected (5.8% is quite a lot of households).
It can be put down to two things:
- Increased international migration and changes to household formation – a particularly important reason for the difference can probably be attributed to the evidence that migrants initially form fewer households (ie two couples share one property) than those who have lived in the UK all their lives.
- Changes to household formation patterns amongst the rest of the population – this includes adult ‘children’ living longer with their parents and more young adults living in shared accommodation (as can be seen in the growth of Homes of Multiple Occupation properties).
So, what does all this mean for Rotherham Homeowners and Landlords? Quite a lot in fact.
There has been a subtle shift to slightly larger households in the last decade, meaning smart landlords might be tempted to buy slightly larger properties to rent out – again, good news for homeowners who will get top dollar for their home as they sell on.
But now with Brexit, household formation might swing the other way in the next decade? Who knows? Watch this space!
If you want to find out more about the Rotherham Property Market, keep coming back to this blog or follow me on Twitter or Facebook. I would love to get in touch with you!