
Nov 21, 2017
I had the most interesting conversation the other day with a local Rotherham accountant, who asked me about my articles here on the Rotherham Property Blog.
He commented enthusiastically on the articles I write and was particularly interested with the graphs, facts and figures contained within them – so much so he recommended some of his clients should read them – many of them are Rotherham homeowners or landlords (or both).
However, one question that kept me on my toes was this:
“With so many House-Price-Indices, how do you know which one to use and how can you calculate what is exactly happening in Rotherham?”
To start with, there are indeed a great number of these Indices, including the Land Registry, the Office of National Statistics, Halifax, Nationwide and LSL to name but a few. The issue occurs when these different house price indices give diverse pictures of the state of the UK housing market.
Whilst some indices measure the average value of every property in the UK (sold or unsold), others measure the average ‘price-paid’ of houses that happen to be sold over a fixed time scale… it can be very confusing!
A lot of the variance between house price indices occurs because of the distinctive ways in which the numerous indices endeavour to beat these issues. You see, the biggest problem in creating a house-price-index when comparing and contrasting with most other indexes (e.g. inflation where the price a ubiquitous tin of beans can easily be measured over the months and years), is every home is unique and as Rotherham people are only moving every 19.5 years, it appears the only thing that can be measured is the price of property sold in a given month.
By their very nature, all of the indices are only able to paint a picture of the whole of the UK or, at best, the regional housing market.
As I have said many times in my articles on the Rotherham property market, it is important to look to the medium term when considering house price inflation/deflation. Looking at the month-to-month changes, many indices look like one of those jumpy lie-detector needles you see in the cold war movies!
I can guarantee you in the coming few months, on a month-by-month basis, one or more of the indices will say property prices will have dropped. Let me tell you, no property market indices are representative of the housing market in the short term. Many indices have shown a drop around the Christmas and New Year months, even the boom years of 2001 to 2007 and 2013 to 2015.
Can there be a Rotherham House Price Index?
So, back to the question, how do we work out what is happening in the Rotherham Property Market and can there be a Rotherham House Price Index?
To calculate what I consider is a fair and proper House Price Index for Rotherham, I initially needed to decide on a starting place for the index. I have chosen 2008 as far enough away, but still gives us a medium/long term view. Next, I split all the house sales into their types (Detached/Semi/House /Apartment) to give us an indication of what is actually selling by postcode district. So, for example, below is a table for the S61 postcode district (the sample shows 2008, 2016 and 2017:

Then I look at the actual numbers of properties sold in the S61 postcode district. Below is the graph with the numbers for the years already mentioned:

Next, I have looked at the prices paid for those types for every year since 2008, again in this example using the sample years of 2008, 2016 and 2017 for the S61 postcode.

Finally, I amalgamated the same data points for the other postcode districts covered by Rotherham and the surrounding villages, weighted it accordingly, to produce the Rotherham House Price Index … which after all that work, currently stands at, for Q4 2017, 107.85 (Q4 2008 = 100).
I hope you found that of interest. Over the coming months and seasons, I shall refer back to the Rotherham House Price Index on this blog. In the meantime, please make sure you get in touch if you have any further questions. I’m also posting information quite frequently on Facebook and Twitter so please do head over there to follow me.
Nov 9, 2017
In the credit crunch of 2008/9 the rate of home moving plunged to its lowest level ever.
In 2009 the rate at which a typical house would change hands slumped to only once every 34 years. The biggest reason being that confidence was low and many homeowners didn’t want to sell their home as Rotherham property prices plunged after the onset of the financial crisis in 2008. However, since 2009, the rate of home moving has increased (see the table and graph below). This means that today:
The average period of time between home moves in
Rotherham is now 19.5 years.
This is an increase of 75.68% between the credit crunch fallout year of 2009 and today, but still it is a 28.58% drop in moves by homeowners, compared to 15 years ago.


So why aren’t Rotherham homeowners moving as much as they did in the Noughties?
The causes of the current state of play are numerous. In my last article I talked about how ‘real’ incomes and savings had been dropping. Another issue is the long-term failure in the number of properties being built. I’ve previously discussed the draconian planning rules that mean house builders struggle to locate building land to actually build on.
Back in the 1960s and 1970s, as a country, we were building on average 300,000 and 350,000 households a year. The Barker Review a few years ago said that for the UK to stand still and keep up with housing demand (through immigration, people living longer and the increase in single person households since the 1980s) we needed to build 240,000 households a year. Over the last few years, we have only been building between 135,000 and 150,000 households a year.
Finally, as the UK population gets older, there is no getting away from the fact that a maturing population is a less mobile one.
So, what does this mean for Rotherham homeowners and landlords?
Well, if Rotherham people are less inclined to move or find it hard to sell a property or acquire a new one, they are probably less likely to move to an improved job or a more prosperous part of the UK.
Many of the older generation in Rotherham are stuck in property that is simply too big for their needs. The fact is that in our area nearly five out of every ten (or 47.0 per cent) owned houses has two or more spare bedrooms. To be more exact, that’s…
33,343 of the 70,919 owned households in the Rotherham Metropolitan Borough area that have two or more spare bedrooms.
So, as their children and grandchildren struggle to move up the housing ladder, with those young families bursting at the seams in homes too small for them, we have a severe case of under-occupation with the older generation – grandparents staying put in their bigger homes, with a profusion of spare bedrooms.
Regrettably, I cannot see how the rate of properties being sold will rise any time soon. Many commentators have suggested the Government should give tax breaks to allow the older generation to downsize, yet in a recent White Paper on housing published just weeks before the General Election, there was no reference of any thoughtful and detailed policies to inspire or support them to do so.
This means that there could be an opportunity for Rotherham buy-to-let landlords to secure larger properties to rent out, as the demand for them will surely grow over the coming years.
As for homeowners… well those in the lower and middle Rotherham market will find it a balanced sellers/buyers market, but will find it slightly more a buyers market in the upper price bands.
As always, there are interesting (and complicated) times ahead!
Follow this blog on Twitter or ‘like’ it on Facebook for all the latest property market news and insights from both here in Rotherham and further afield.
Oct 31, 2017
As I mentioned recently, the average house price in Rotherham is 5.39 times the average annual Rotherham salary. This is lower than the last peak of 2008, when the ratio was 5.42. A number of commentators anticipated that in the ambiguity that trailed the Brexit vote, UK (and hence Rotherham) property prices might drop like a stone. The point is this… they haven’t.
It is true the market for Rotherham’s swankiest and poshest properties looks a little fragile (although they are selling if they are realistically priced) and overall, Rotherham property price growth has slowed, but the lower to middle Rotherham property market appears to be quite strong.
A different long-term picture
Scratch under the surface though, and a different long-term picture is emerging away from what is happening to property prices.
Rotherham people are moving home less often than they once did. Data from the Office of National Statistics shows that the number of properties sold in 2016 is again much lower than it was in the Noughties. My statistics show…

Even though we are not anywhere near the low post credit crunch levels of property sales, the torpor of the Rotherham housing market following the 2016 Brexit vote has seen the number of property sales in Rotherham and the surrounding local authority area level off to what appears to be the start of a new long term trend (compared to 2000-2009).
Interestingly, it was the 1980s that saw the highest levels of people moving home.
During the 1980s, across the nation the average was that everyone would move house once a decade. Even though it was during the Labour administration of the late 1970s where the right to buy one’s council house started, it was the Housing Act in 1980 that that really got council tenants moving, as Thatcher’s Tory government financially encouraged council tenants to buy their council-rented homes – for which countless then sold them on for a profit and moved elsewhere.
The housing market was awash with money as banks were allowed to offer mortgages as well as the existing building societies, meaning it made it simpler for Brits to borrow even more money on mortgages and to climb up the housing ladder.
A new trend
However, it is clear that a new trend of the number of property sales appears to have started. Looking at the figures in the Rotherham area since 2010/11 this is obvious.
Interestingly, this has been mirrored nationally.
The reasons behind this are complex, but a good place to start is the growth rate of real UK household disposable income, which has fallen from 5.01% a year in 2000 to 1.68% in 2016.
Also, things have deteriorated since the country voted to leave the EU as consumer price inflation has risen to 2.7% per annum, meaning inflation has eaten away at the real value of wages (as they have only grown by 1.1% in the same time frame).
With meagre real income growth, it has become more difficult for homeowners to accumulate the savings needed to climb up the housing ladder as the level of saving has also dropped from 4.26% of household income to -1.11% (i.e. people are eating into their savings).
Next week I will be discussing how these (and other issues) have meant the level of Rotherham people moving home has slumped to once every 19.5 years.
Tune in next week… and in the meantime, please feel free to follow my Twitter and Facebook accounts for the latest news about Rotherham and the local property market!
Oct 16, 2017
I recently read a report by the Yorkshire Building Society that 54% of the country has seen wages (salaries) rise faster than property prices in the last 10 years.
The report said that in the Midlands and North, salaries had outperformed property prices since 2007, whilst in other parts of the UK, especially in the South, the opposite has happened and property prices have outperformed salaries quite noticeably.
As regular readers of my blog know, I always like to find out what has actually happened locally in Rotherham. To talk of North and South is not specific enough for me.
Therefore, to start, I examined how salaries have changed in our area since 2007. Looking at the Office of National Statistics (ONS) data for Rotherham Metropolitan Borough Council, some interesting figures came out…

It’s clear from the graph that salaries in Rotherham are significantly lower than the national average. Still, salaries in Rotherham have risen by 14.91% since 2007 (although it’s been a bit of a rollercoaster ride to get there!) This is interesting when you compare that with what has happened to salaries regionally (an increase of 17.08%) and nationally, an increase of 17.61%.
Next, I needed to find what had happened to property prices locally over the same time frame of 2007 and today. Net property values in Rotherham are 3.6% higher than they were in Spring 2007 (not forgetting they did dip in 2008 and 2009). Therefore…
Wages in the Rotherham area have increased at a higher rate than property values to the tune of 11.31% … meaning, Rotherham is in line with the regional trend

All this is important, as the relationship between salaries and property values is the basis on how affordable property is to first (and second, third etc.) time buyers. It is also vitally relevant for Rotherham landlords as they need to be aware of this when making their buy-to-let plans for the future. If more Rotherham people are buying, then demand for Rotherham rental properties will drop (and vice versa).
As I have discussed in a few articles in my blog recently, this issue of ‘property-affordability’ is a great bellwether to the future direction of the Rotherham property market.
Now of course, it isn’t as simple as comparing salaries and property prices, as that measurement disregards issues such as low mortgage rates and the diminishing proportion of disposable income that is spent on mortgage repayments.
On the face of it, the change between 2007 and 2017 in terms of the ‘property-affordability’ hasn’t been that great. However, look back another 10 years to 1997, and that tells a completely different story. Nationally, the affordability of property more than halved between 1997 and today. In 1997, house prices were on average 3.5 times workers’ annual wages, whereas in 2016 workers could typically expect to spend around 7.7 times annual wages on purchasing a home.
“Not a realistic goal”
The issue of a lack of homeownership has its roots in the 1980s and 1990s.
It’s quite hard as a tenant to pay your rent and save money for a deposit simultaneously, meaning for many Rotherham people, home ownership isn’t a realistic goal.
Earlier in the year, the Tories released proposals to combat the country’s ‘broken’ housing market, setting out plans to make renting more affordable, while increasing the security of rental deals and threatening to bring tougher legal action to cases involving bad landlords.
This is all great news for Rotherham tenants and decent law-abiding Rotherham landlords (and indirectly owner occupier homeowners). Whatever has happened to salaries or property prices in Rotherham in the last 10 (or 20) years, the demand for decent high-quality rental property keeps growing.
If you want a chat about where the Rotherham property market is going like many Rotherham landlords are doing then please get in touch via the contact page. You can also check out my other articles or follow me on Facebook and Twitter.
Oct 10, 2017
Moving to a bigger home is something Rotherham people with growing young families aspire to. Many people in two bedroom homes move to a three-bedroom home and some even make the jump to a four-bed home. Bigger homes, especially three-bed Rotherham homes are much in demand and it can be a costly move.
If you live in Rotherham in a two-bedroom property and wish to move to a four-bedroom house in Rotherham, you would need to spend an additional £166,180 (or £656.41 per month in mortgage payments (based on the UK Bank average standard variable rate)). However, going straight to a four bed from a two-bed home is quite rare as most people jump from a two to three-bedroom home and then later in life, make the transition from a three to four-bedroom home.
So, after being asked my thoughts on moving home in Rotherham by a friend recently, please find my analysis of the local property market and then some thoughts. To start with, let us see what the average property price is for a Rotherham property by the number of bedrooms it has.

I then decided to calculate what it would cost to make the jump upmarket from one bedroom to two bedrooms, two to three bedrooms etc, etc, both in actual money and in mortgage payments (using the current standard variable rate of UK Banks of 4.74% – so the mortgage cost could be higher or lower depending on the mortgage taken).

There are some interesting jumps in costs when moving upmarket as a Rotherham buyer. The cost of moving from one to two beds, and two to three beds is relatively reasonable, whilst the jump from three to four beds in Rotherham is quite high and therefore financially prohibitive for most families. This helps provide a partial explanation as to why some four-bed properties are currently taking slightly longer to sell.
Advice for buy-to-let landlords
As an aside, there is a lesson here for all my blog readers.
You can quite clearly see why the larger 4 and 5 bed properties don’t offer the best returns for buy-to-let. Simply put the monthly finance costs and rents achieved don’t match up so well (i.e. a mortgage for a 4 bed home in Rotherham would cost you 105.03% compared to a 3 bed mortgage, but the jump in rent would be a lot less than that). I don’t wish to be dismissive about the solidity of investing in larger properties because it does depend on your circumstances. Four bedroom properties sometimes offer other advantages. Pick up the phone if you want to know what they are in more detail.
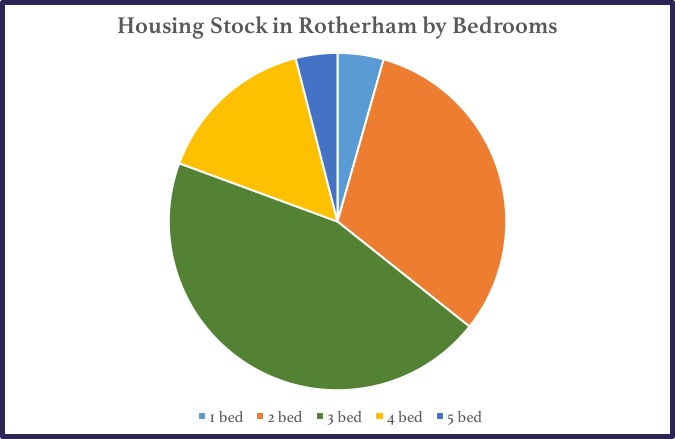
A further look at the stock of properties in Rotherham is revealing.

The most active purchasers are 20 and 30 something home-owning parents with growing families. Many look to more modern developments for the perfect balance of access to decent primary schools, commutability and lifestyle.
 For landlords looking to buy within Rotherham, they face stiff competition from these 20/30 something families, making the three bedroom Rotherham home massively in demand, often attracting spirited offers and selling within weeks of listing. This mix of homebuyers and landlords is a pressure point in the Rotherham property market. Again, if you are a landlord, call me and I will show you areas with decent returns where you aren’t in so much competition with young Rotherham family homebuyers. Also, keep your eye on the featured property section of our blog – we post some great deals with high yields that are worth taking a look at.
The cost of an additional bedroom can often be too much
The cost of an additional bedroom can be too much for some Rotherham buyers. It is quite challenging moving home the first time, but to then find you are priced out on the next move up the ladder can be quite disconcerting, with families often having to move to a different part of town to get the bigger home they need.
Nevertheless, that’s the position many homeowners find themselves in with the cost of the additional bedroom being too much to bear.
To those buying their home for the first time, all I suggest is they not only consider the mortgage payments and other costs of their first home, but also do their homework into their next rung up the Rotherham property ladder. Thinking about it now will keep you ahead of the game in the future as your number of bedrooms, family property needs and lifestyle wants change.
…and Rotherham landlords – well these changes in the way people live also mean there are opportunities to be had in the Rotherham rental market. Many Rotherham landlords are starting to pick my brain on this, so if you don’t want to miss out – get in touch for my advice. You can also follow us on Twitter or Facebook for up-to-date insights.
Page 8 of 29« First«...678910...20...»Last » 


 For landlords looking to buy within Rotherham, they face stiff competition from these 20/30 something families, making the three bedroom Rotherham home massively in demand, often attracting spirited offers and selling within weeks of listing. This mix of homebuyers and landlords is a pressure point in the Rotherham property market. Again, if you are a landlord, call me and I will show you areas with decent returns where you aren’t in so much competition with young Rotherham family homebuyers. Also, keep your eye on